
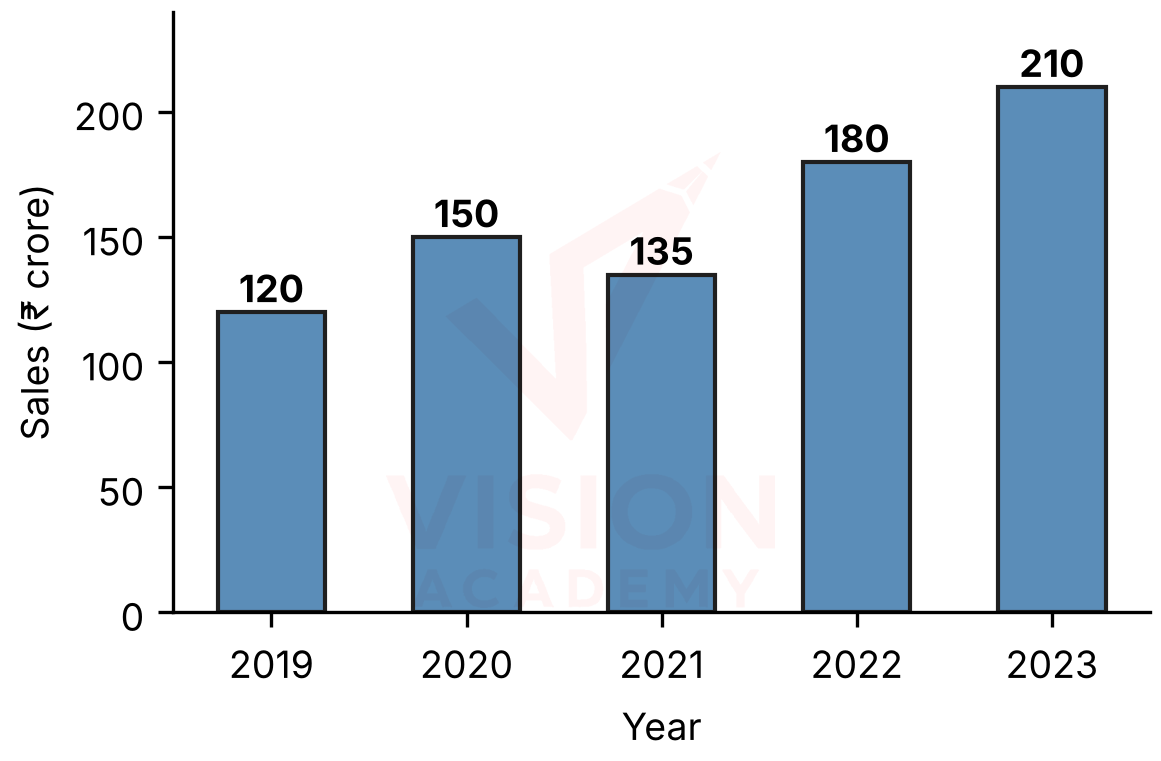
The bar chart shows the annual sales (in ₹ crore) of a company from 2019 to 2023. In which year was the percentage increase in sales over the previous year the highest?
Answer (Detailed Solution Below)View answer ▾Hide ▴
Answer: Option C — 2022
Detailed Solution
2020: %; 2021: a fall of 10%; 2022: %; 2023: %.
The highest is 2022.
✓ Check
2023 has the same absolute rise (30) as 2020 but on a larger base, so its percentage is smaller.⚠ Common trap
(D) 2023 — has the highest sales, not the highest percentage rise.Quick tip
Compare rise / previous value, not the size of the bar
💬 Discussions on this question
Ask a doubt ›Still stuck on this question? Ask our faculty and fellow students — answers appear here.
Ask a doubtMore Data Interpretation Questions
View all ›- Q1.Ranveer is very health conscious and wants to pick a diet that is highest in protein and lowest in fat. From the options given, which diet should he choose? (Product A: Protein 20%, Carbohydrates 10%, Fat 40%)
- Q2.The bar chart shows the annual sales (in ₹ crore) of a company from 2019 to 2023. What is the percentage increase in sales from 2021 to 2022?
- Q3.The bar chart shows the annual sales (in ₹ crore) of a company from 2019 to 2023. What are the average annual sales over the five years?
- Q4.The bar chart shows the annual sales (in ₹ crore) of a company from 2019 to 2023. What is the ratio of the total sales of 2019 and 2020 to the total sales of 2022 and 2023?
More Quantitative Aptitude Questions
- Q1.By selling 45 lemons for ₹40, a man loses 20%. How many lemons should he sell for ₹24 to gain 20%?Profit, Loss & Discount
- Q2.The marked price of an article is 1.45 times its cost price. Its selling price is ₹1,500 and the profit is 25%. What is the discount percentage? Profit, Loss & Discount
- Q3.Let A be a real number. Then the roots of the equation are real and distinct if and only if Quadratic Equations
- Q4.The number of distinct real roots of the equation is Quadratic Equations
- Q5.The roots of are:Quadratic Equations
Data Interpretation — Preparation
This question tests your understanding of Data Interpretation, a key topic in the Quantitative Aptitude section. The detailed solution above uses a step-by-step approach to show the reasoning, and where available, a shortcut that helps you solve similar questions in under 90 seconds during the actual exam.
Data interpretation (DI) questions present data in a table, bar graph, line graph, pie chart or a combination, and ask a set of questions based on it. The questions test calculation skills applied to real-looking data: percentages and percentage change, ratios, averages, growth rates, and comparisons between years or categories. Speed comes from two habits. First, read the chart carefully before answering, including its title, units and scale. Second, approximate wherever the options are far enough apart. Strong percentage and fraction skills (knowing that 1/8 = 12.5% or 1/6 = 16.67%) make most DI calculations quick. For pie charts, remember that a full circle is 360 degrees and each 1% equals 3.6 degrees. In the exam, attempt the DI sets with the cleanest data first. Practise the data interpretation sets below. Each question has a step-by-step solution with approximation shortcuts.